Monitor memory and CPU usage for single-node batch jobs on Quartz or Big Red 200
On this page:
Overview
The collectl utility is a system-monitoring tool that records specific operating system data for one or more sets of subsystems. Any set of subsystems (for example, CPU, disks, memory, or processes) can be included in or excluded from data collection. Data can be stored in compressed or uncompressed data files, which themselves can be in either raw format or in a space-delineated format that enables plotting using gnuplot or Microsoft Excel.
You can use collectl to monitor the memory and CPU usage of single-node batch jobs running on Quartz or Big Red 200. Output from collectl can help you determine how many serial applications you can run on a single node. Likewise, you can use collectl output to help determine the resources you need to request to run your batch job.
Prepare a shell script
The collectl utility runs a lightweight application alongside your binary, capturing its memory and CPU usage as it runs on a compute node.
A simple way to launch collectl alongside your binary is to prepare a simple shell script, which you can later submit to Slurm using a job script.
For example, consider the following shell script (my_script.sh) for launching the binary ./my_binary:
#!/bin/bash

cd /N/scratch/username/temp
./my_binary
To have collectl record subsystem data as your binary runs, add lines to the shell script for loading the collectl module (if you are on Big Red 200, collectl is available to you without needing to load a module), including data collection instructions, and stopping data collection after your binary has finished running.
For example, after applying such changes, the my_script.sh shell script on Quartz would look similar to this:
#!/bin/bash

module load collectl
cd /N/scratch/username/temp
SAMPLEINTERVAL=10
COLLECTLDIRECTORY=/N/scratch/username/temp/
collectl -F1 -i$SAMPLEINTERVAL:$SAMPLEINTERVAL -sZl --procfilt u$UID -f $COLLECTLDIRECTORY &
./my_binary
collectl_stop.sh
In the above example:
- Adjust
SAMPLEINTERVALaccording to the expected runtime for your application. If your job will run for less than a day, UITS recommends settingSAMPLEINTERVAL=10; if your job will run for multiple days, setSAMPLEINTERVAL=30orSAMPLEINTERVAL=60. - To point
COLLECTLDIRECTORYto a directory namedtempin your Slate-Scratch directory, make sure thetempdirectory already exists in your Slate-Scratch directory and, in your script, replaceusernamewith your IU username. - The
&at the end of thecollectlcommand places thecollectlprocess in the background, allowing your script to issue other commands (for example,./my_binary) whilecollectlruns and collects data. - The
collectl_stop.shcommand kills thecollectlprocess, stopping data collection.
Options
Following is a summary of commonly used collectl options; for a complete list, load the collectl module, and then refer to the collectl manual page (man collectl):
| Option | Description | ||||
|---|---|---|---|---|---|
-F |
Flushes the output buffers at the specified interval (in seconds); -F0 (zero) causes a flush at each sample interval |
||||
-i |
Indicates how frequently a sample occurs (in seconds) The value preceding the colon ( The value following the colon is the rate at which subsystem, subprocess ( |
||||
-s |
Determines what subsystem data (summary or detail) is collected; the default is Options for summary and detailed subsystem data include:
Note: In the above example script, |
||||
--procfilt |
Tells In the above example, the Other filters and options for specifying what data to monitor and how to record them include |
||||
-f |
Sets the directory for collectl output |
Plot output
After your job has run to completion, collectl will place an output file (for example, nid00862-20130826-130847.raw.gz) in the directory specified by COLLECTLDIRECTORY. You then can use the collectl_plot.sh shell script to create a chart depicting the runtime characteristics of your application.
collectl_plot.sh from a login node. Also, you'll need to load the collectl module (module load collectl), if you haven't already, before launching collectl_plot.sh.
For example:
collectl_plot.sh output_file .In the above example, replace output_file with the name of the collectl output file (for example, nid00862-20130826-130847.raw.gz). Remember to include the period (.) at the end of the line.
Running collectl_plot.sh will create a collectl_plot_tmp subdirectory off the current directory that will contain the files used to create the plots, which will appear in your current directory as .eps files.
The default charts produced after running collectl_plot.sh are:
| File name | Data plotted | Example |
|---|---|---|
ram.eps |
Memory usage of each application | 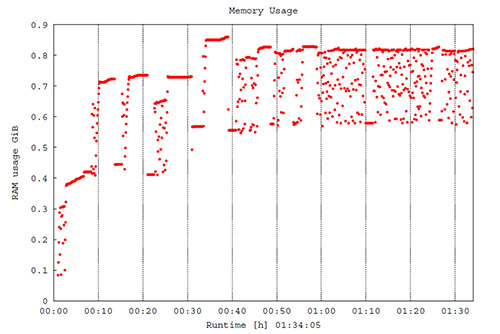 |
ram_sum.eps |
Summary of memory usage | 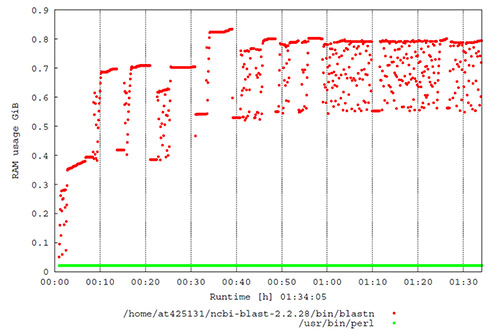 |
io.eps |
I/O usage of each application | 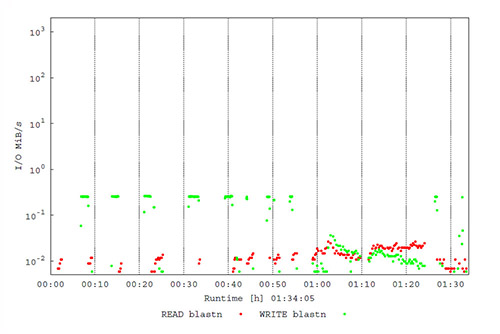 |
io_sum.eps |
Summary of I/O usage | 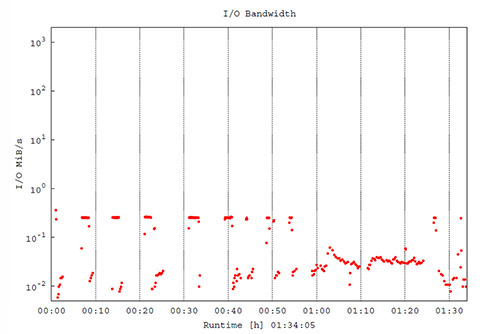 |
cpu.eps |
CPU usage of each application | 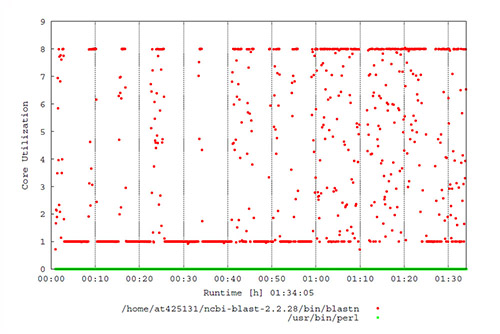 |
cpu_sum.eps |
Summary of CPU usage | 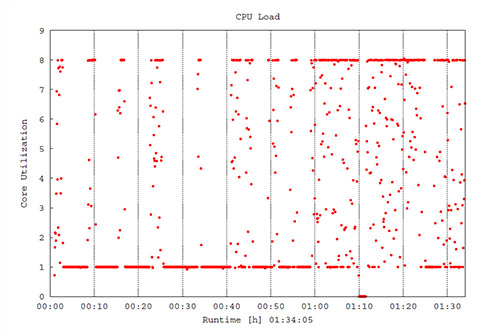 |
You can view these files using any graphics program that can read .eps files (for example, Acrobat, Apple Preview, Ghostview, Illustrator, and Photoshop, among others). Alternatively, you can drag them into an open Microsoft Word document, or use Word's function.
collectl_plot.sh contain only detail data for processes (those collected by the -sZ flag). If you specified collection of other subsystem data in your collectl command (for example, -sl or -sm), those data will be recorded in the collectl output (raw.gz) file, although collectl_plot.sh will not plot them.
If your application does not run long enough to generate multiple data points, collectl_plot.sh may create empty files. In such cases, collectl_plot.sh may generate messages indicating it encountered errors while parsing the data.
Get help
For more, see the collectl manual page (man collectl) or visit the Collectl project page.
If you need help or have questions about using collectl, contact the UITS Research Applications and Deep Learning team.
This is document bedc in the Knowledge Base.
Last modified on 2024-02-21 14:44:36.